El Niño Southern Oscillation (ENSO)
New! Historical temperature/precipitation ENSO probabilities are available for countries associated with the FEWS NET program.
Introduction
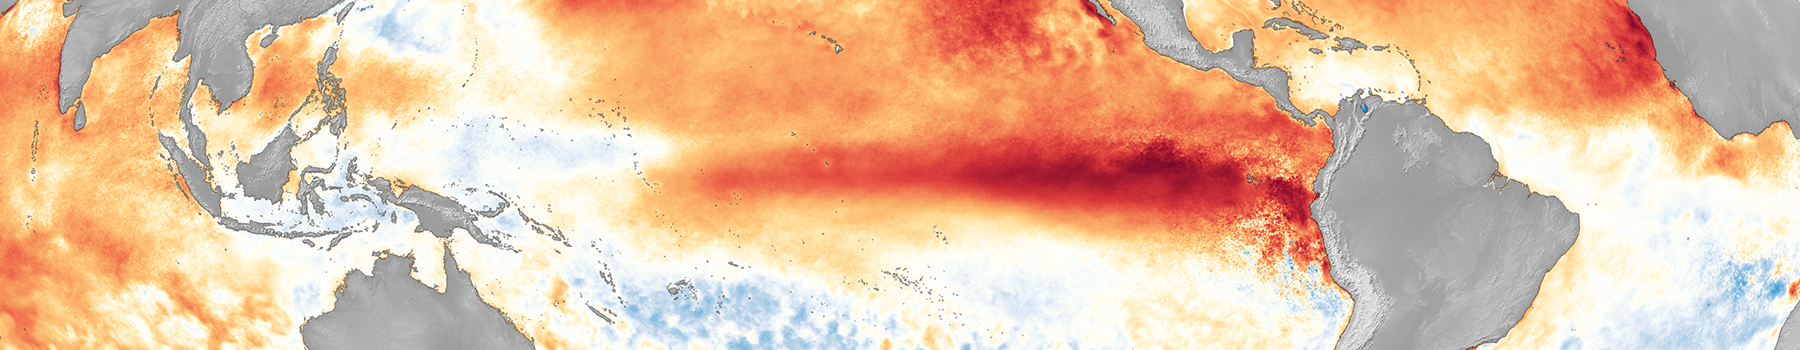
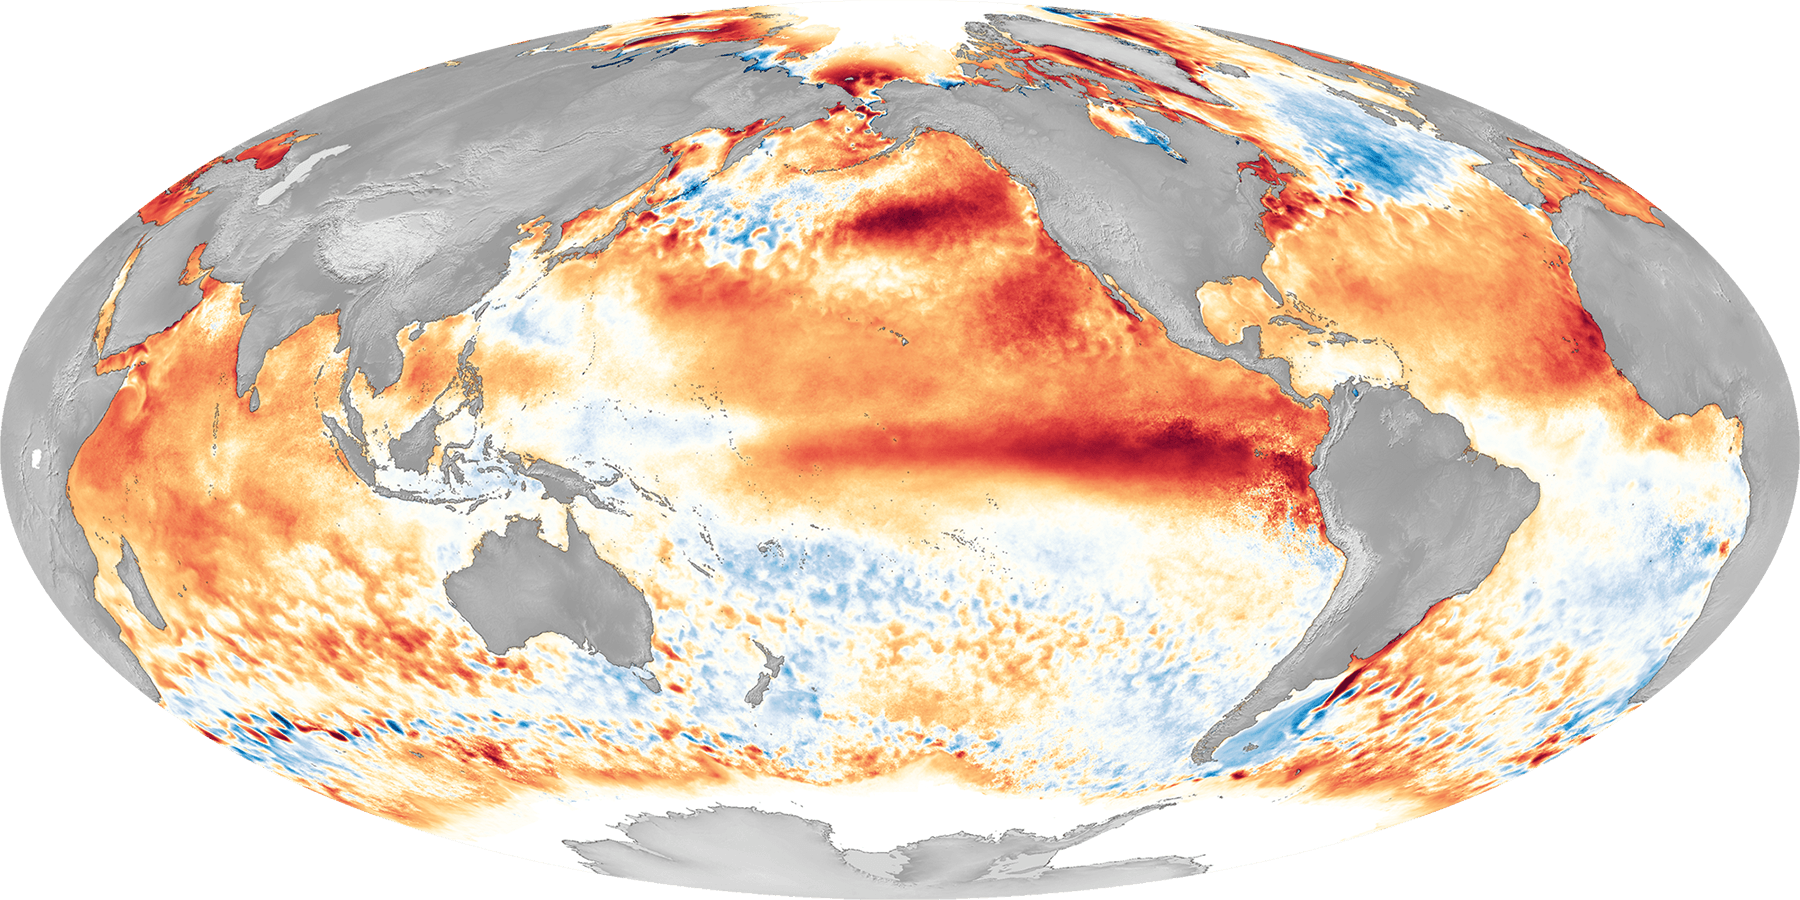
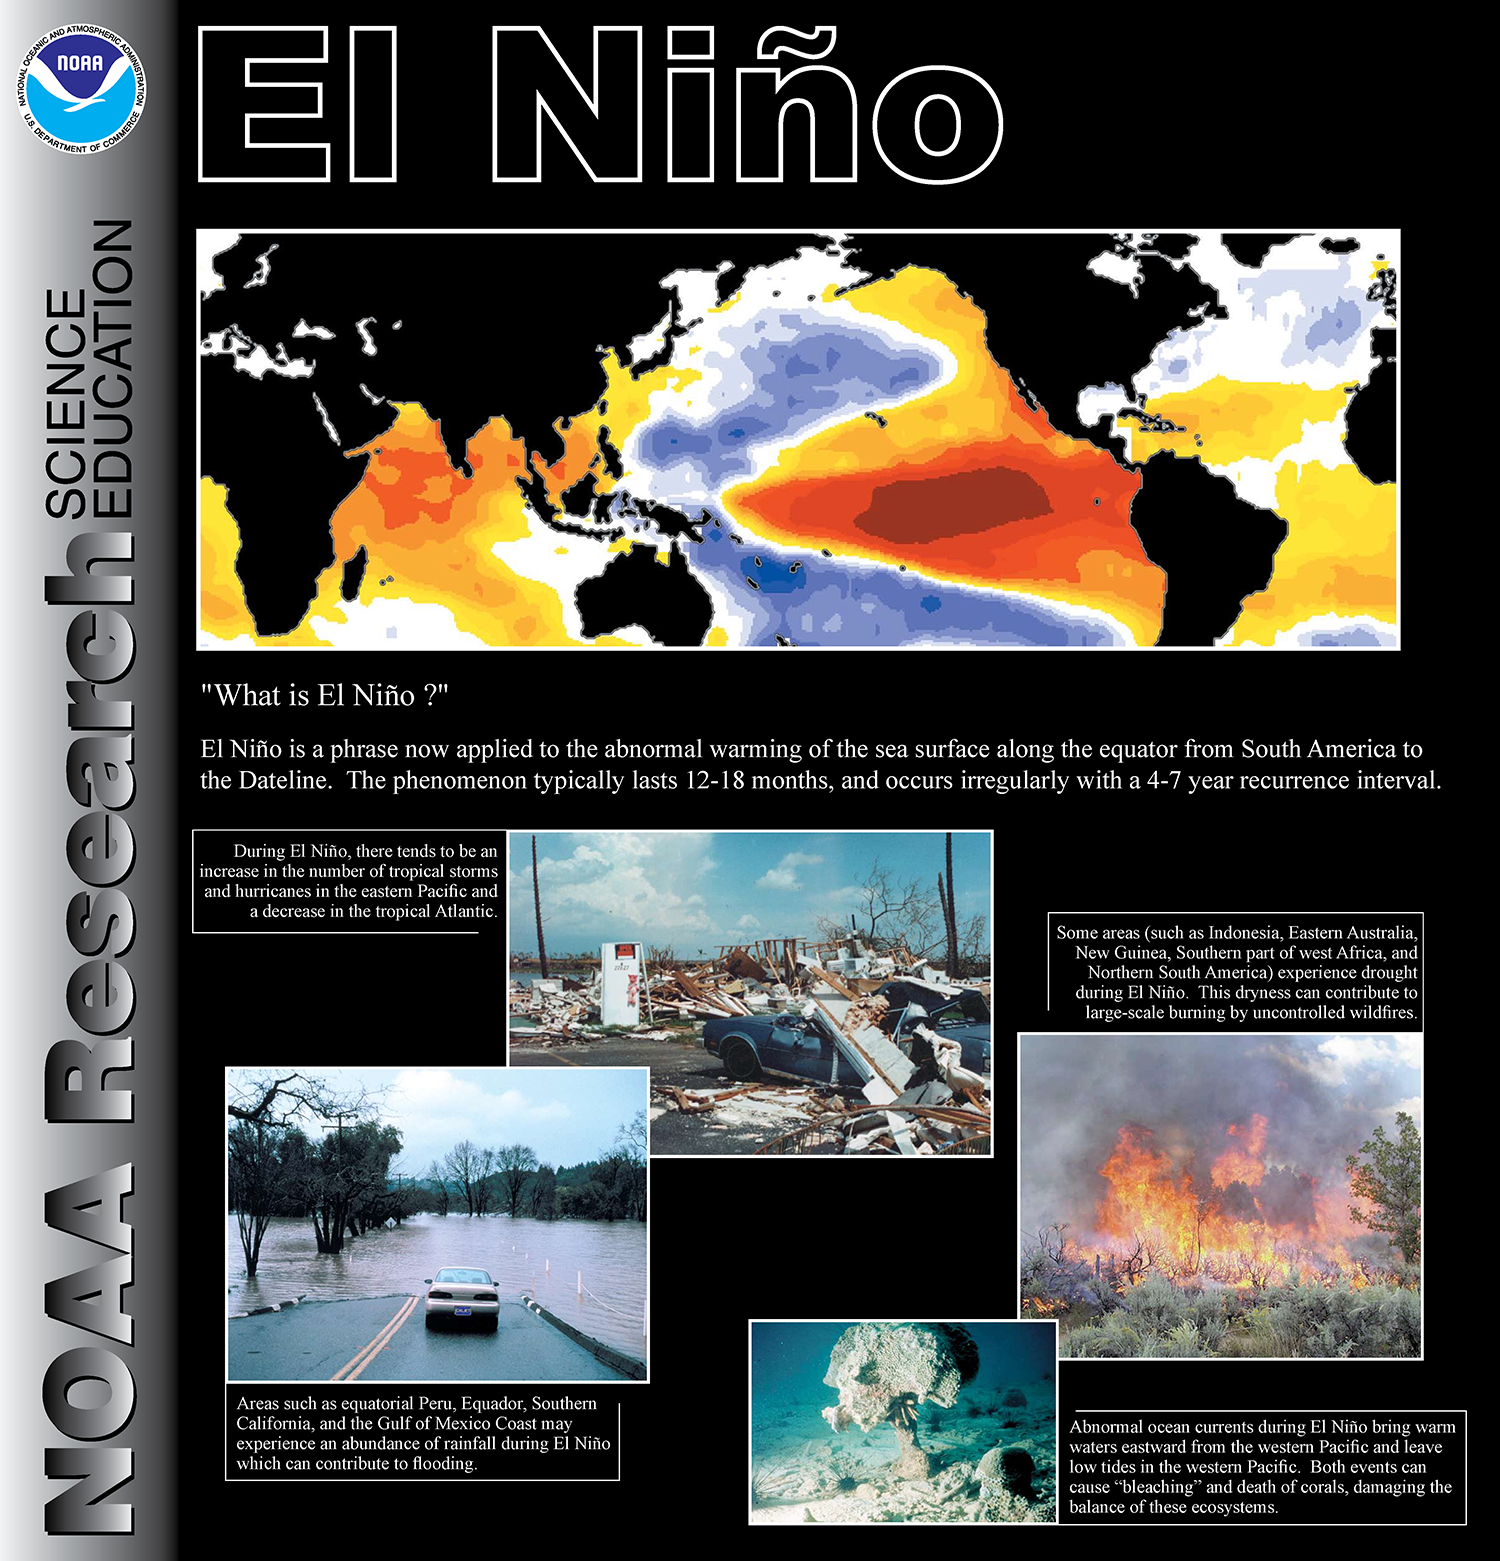
The connection between Earth’s oceans and atmosphere has a direct impact on the weather and climate conditions we experience. El Niño and La Niña, together called the El Niño Southern Oscillation (ENSO), are episodic departures from expected sea surface temperatures (SSTs) in the equatorial Pacific Ocean. These warmer or cooler than normal ocean temperatures can affect weather patterns around the world by influencing high and low pressure systems, winds, and precipitation. ENSO may bring much needed moisture to a region while causing extremes of too much or too little water in others.
Understanding the processes driving these types of interactions is a key component in improving forecasts and warnings. The NOAA Physical Sciences Laboratory studies multiple aspects of ENSO including its precursors, prediction, diversity, and climate and ecosystem impacts. This information can help keep communities safe and guide decisions related to issues such as water management, emergency planning, and ecosystem resilience.
More detailed information about ENSO can be found on the ENSO-101 tab.


ENSO 101
Some Basics
What are El Niño and La Niña?
El Niño is characterized by unusually warm ocean temperatures along the the Equatorial Pacific, whereas La Niña is characterized by unusually cold ocean temperatures in this region. These variations from "normal" temperatures influence the tropical Pacific ocean—atmosphere system, which in turn impacts weather and climate around the globe. The term El Niño Southern Oscillation (ENSO) basically refers to both the El Niño and La Niña phenomena together. See this page for a more detailed explanation of what happens in the ocean and atmosphere during ENSO.
")
How often does ENSO occur?
While their frequency can be quite irregular, El Niño and La Niña events occur on average every 2—7 years. Typically, El Niño occurs more frequently than La Niña.
How long does ENSO last?
How will ENSO impact a particular region?
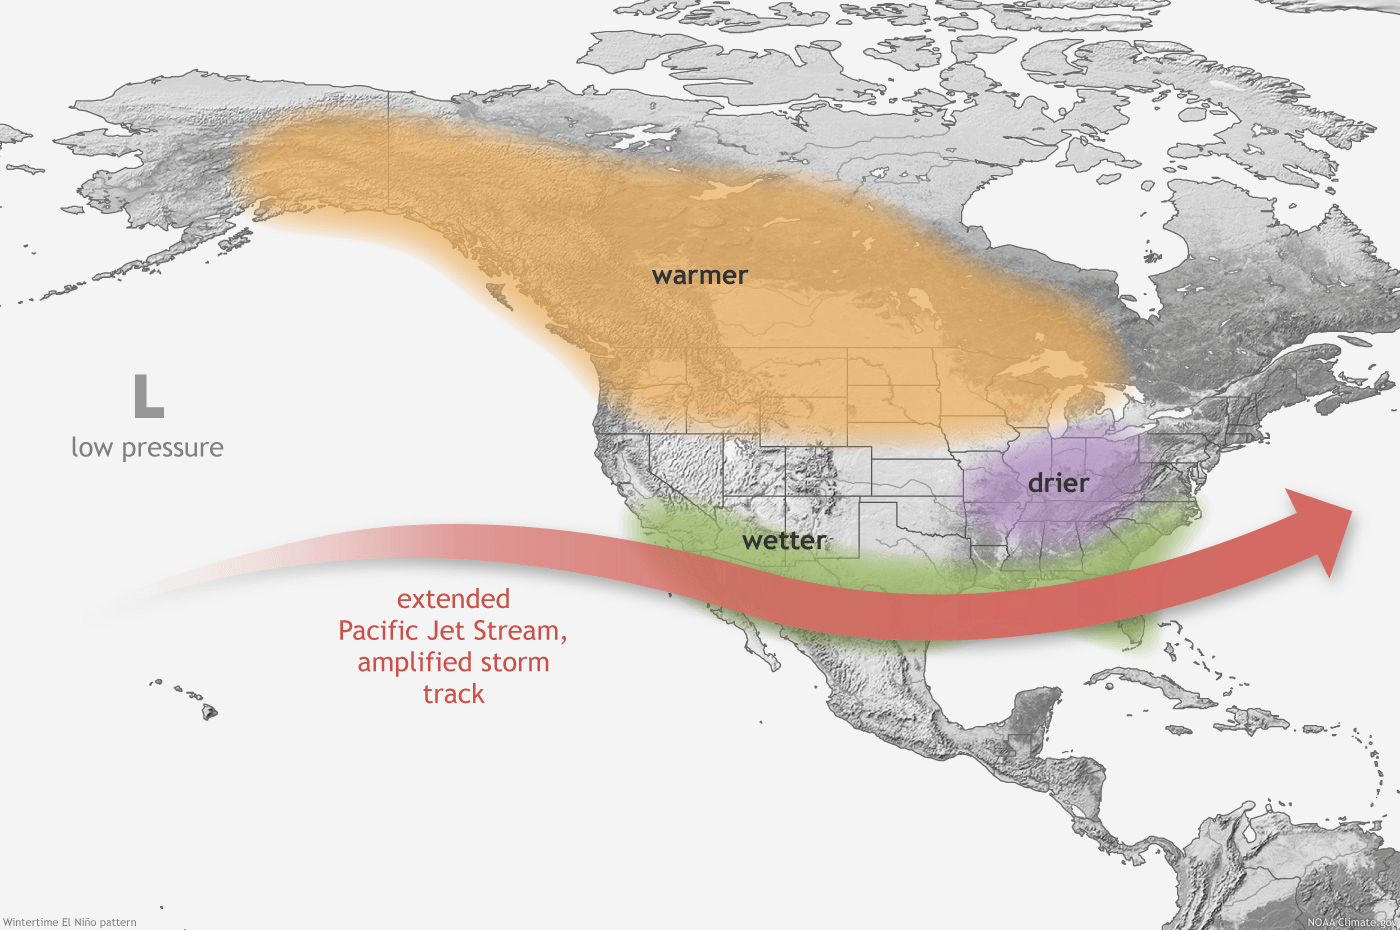
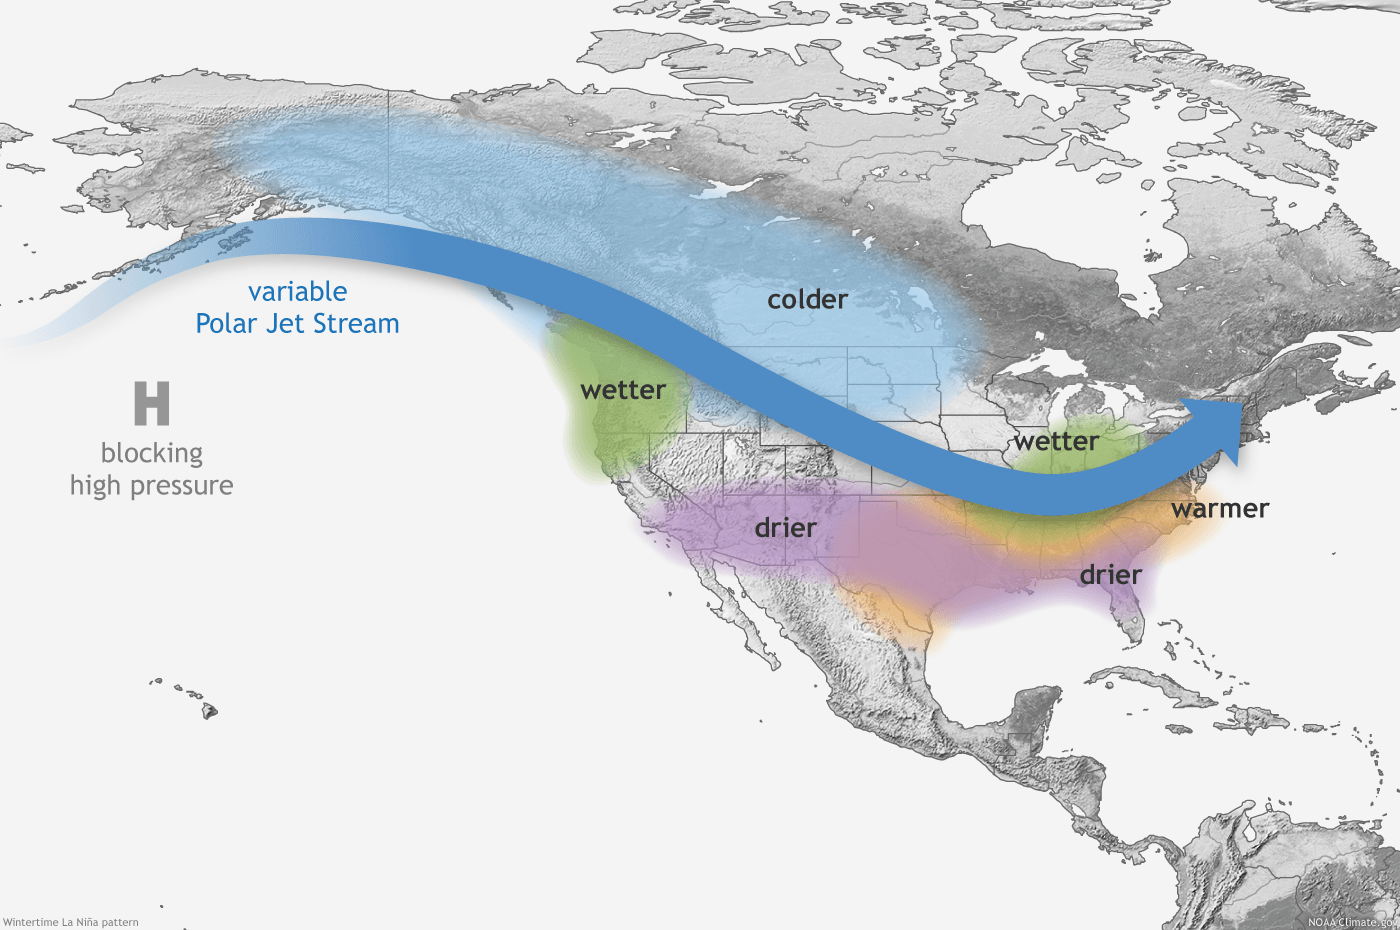
There has been a lot research investigating the effects of El Niño and La Niña on climate (temperature, rainfall, snowpack, climate extremes, etc.) around the world. However, these impacts can be different from year-to-year due to the varying nature of ENSO, and variations in the atmosphere–ocean system. The images below show typical El Niño and La Niña wintertime patterns for the U.S. Detailed information about worldwide impacts can be found on NOAA's El Niño Theme Page.
What is the Southern Oscillation Index (SOI)?
The cyclic warming and cooling of the eastern and central Pacific can be seen in the sea level pressure in the region. For example, when the pressure measured at Darwin, Australia is compared with that measured at Tahiti, the differences between the two can be used to generate an "index" number. A positive number indicates La Niña, and a negative number indicates El Niño. Historical and recent values can be found at NOAA's Climate Prediction Center .
Learn More
For Students and Teachers
Data In the Classroom (NOAA/NESDIS)
Investigating El Niño Online Activity
El Niño Student Activity (NOAA/OAR)
Student Booklet
Teacher Information on El Niño
Activity Key
Our Research
Selected Topics
- 2016 El Niño Rapid Response Field Campaign
An unprecedented field campaign to study El Niño while the event is ongoing. - Climate Division Risk Maps
Does El Niño increase the chances of extreme temperatures or precipitation over the U.S.? PSL researchers have produced risk maps to investigate these questions. - MEI V2 ENSO Monitorings
Current and historic values of the Multivariate ENSO Index developed at PSL. - California Drought
What can drought-stricken California expect from the El Niño winter forecast? PSL researchers contributed to the Drought Task Force report - Hydrology in a Warming Climate; Hydrology That Might Have Been
Ongoing research into the effects of warming on snowpack and streamflow. - Wind River/Greater Yellowstone Area and El Niño
PSL scientists collaborate with the North Central Climate Science Center to address ENSO risks of drought on the Wind River reservation.
News and Feature Stories Related to ENSO
- How far ahead could the February 2021 central US cold snap have been predicted? New study investigates sources of predictability of the event
- Study takes in-depth look at decade-long variations in the tropical Pacific that influence global climate
- Unprecedented effort launched to discover how El Niño affects weather
- Study confirms link between El Niño intensity and precipitation in California
- Andy Hoell contributes to Famine Early Warning Systems Network (FEWS NET) Alert on El Niño
- Researchers examine whether distinct 'flavors' of El Niño/La Niña may exist
- Taking the 'Noise' Out of Ocean Temperature Trends
- El Niño and Probability
- Global Patterns of the Risk of Seasonal Extremes Related to ENSO
Publications
- PSL ENSO Publications (1987–Present)
Current Conditions
Below is a quick look at what's going on right now. You may also want to check out the Climate.gov ENSO Blog .
Sea Surface Temperature (SST)
Today's SSTs
Today's SST Anomalies
Outgoing Longwave Radiation (OLR)
Today's OLR
Today's OLR Anomalies
Animations
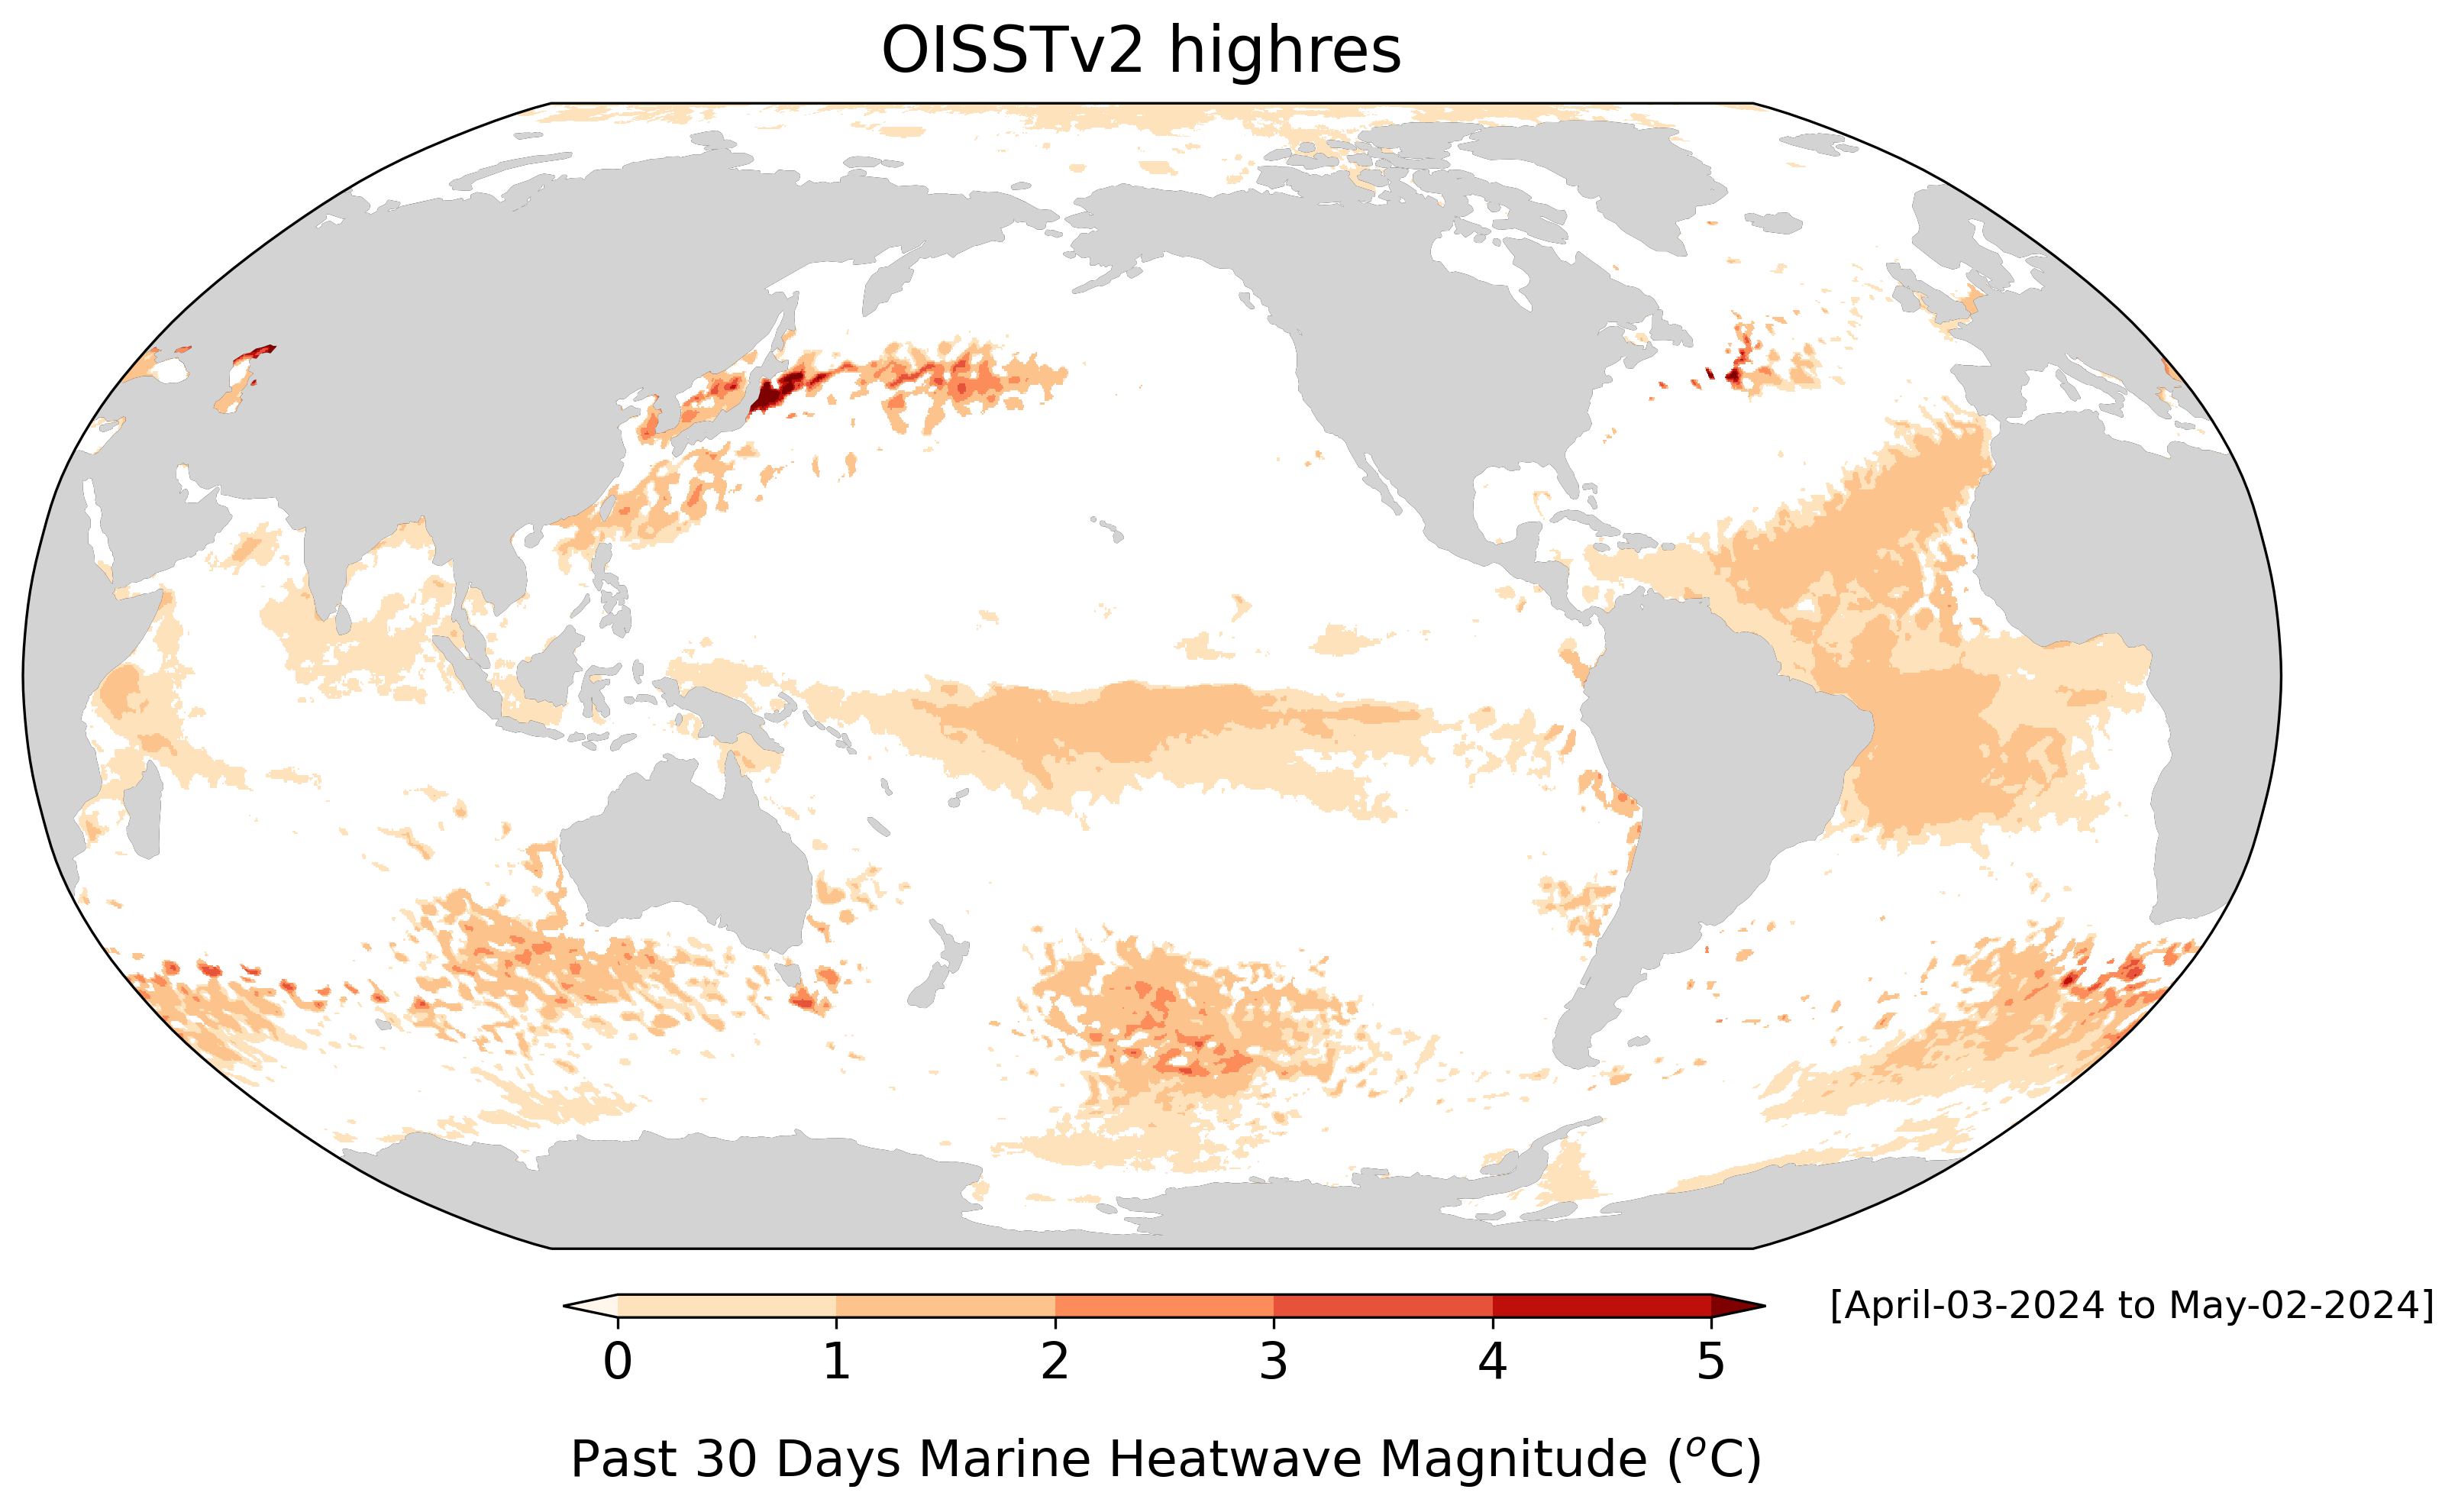
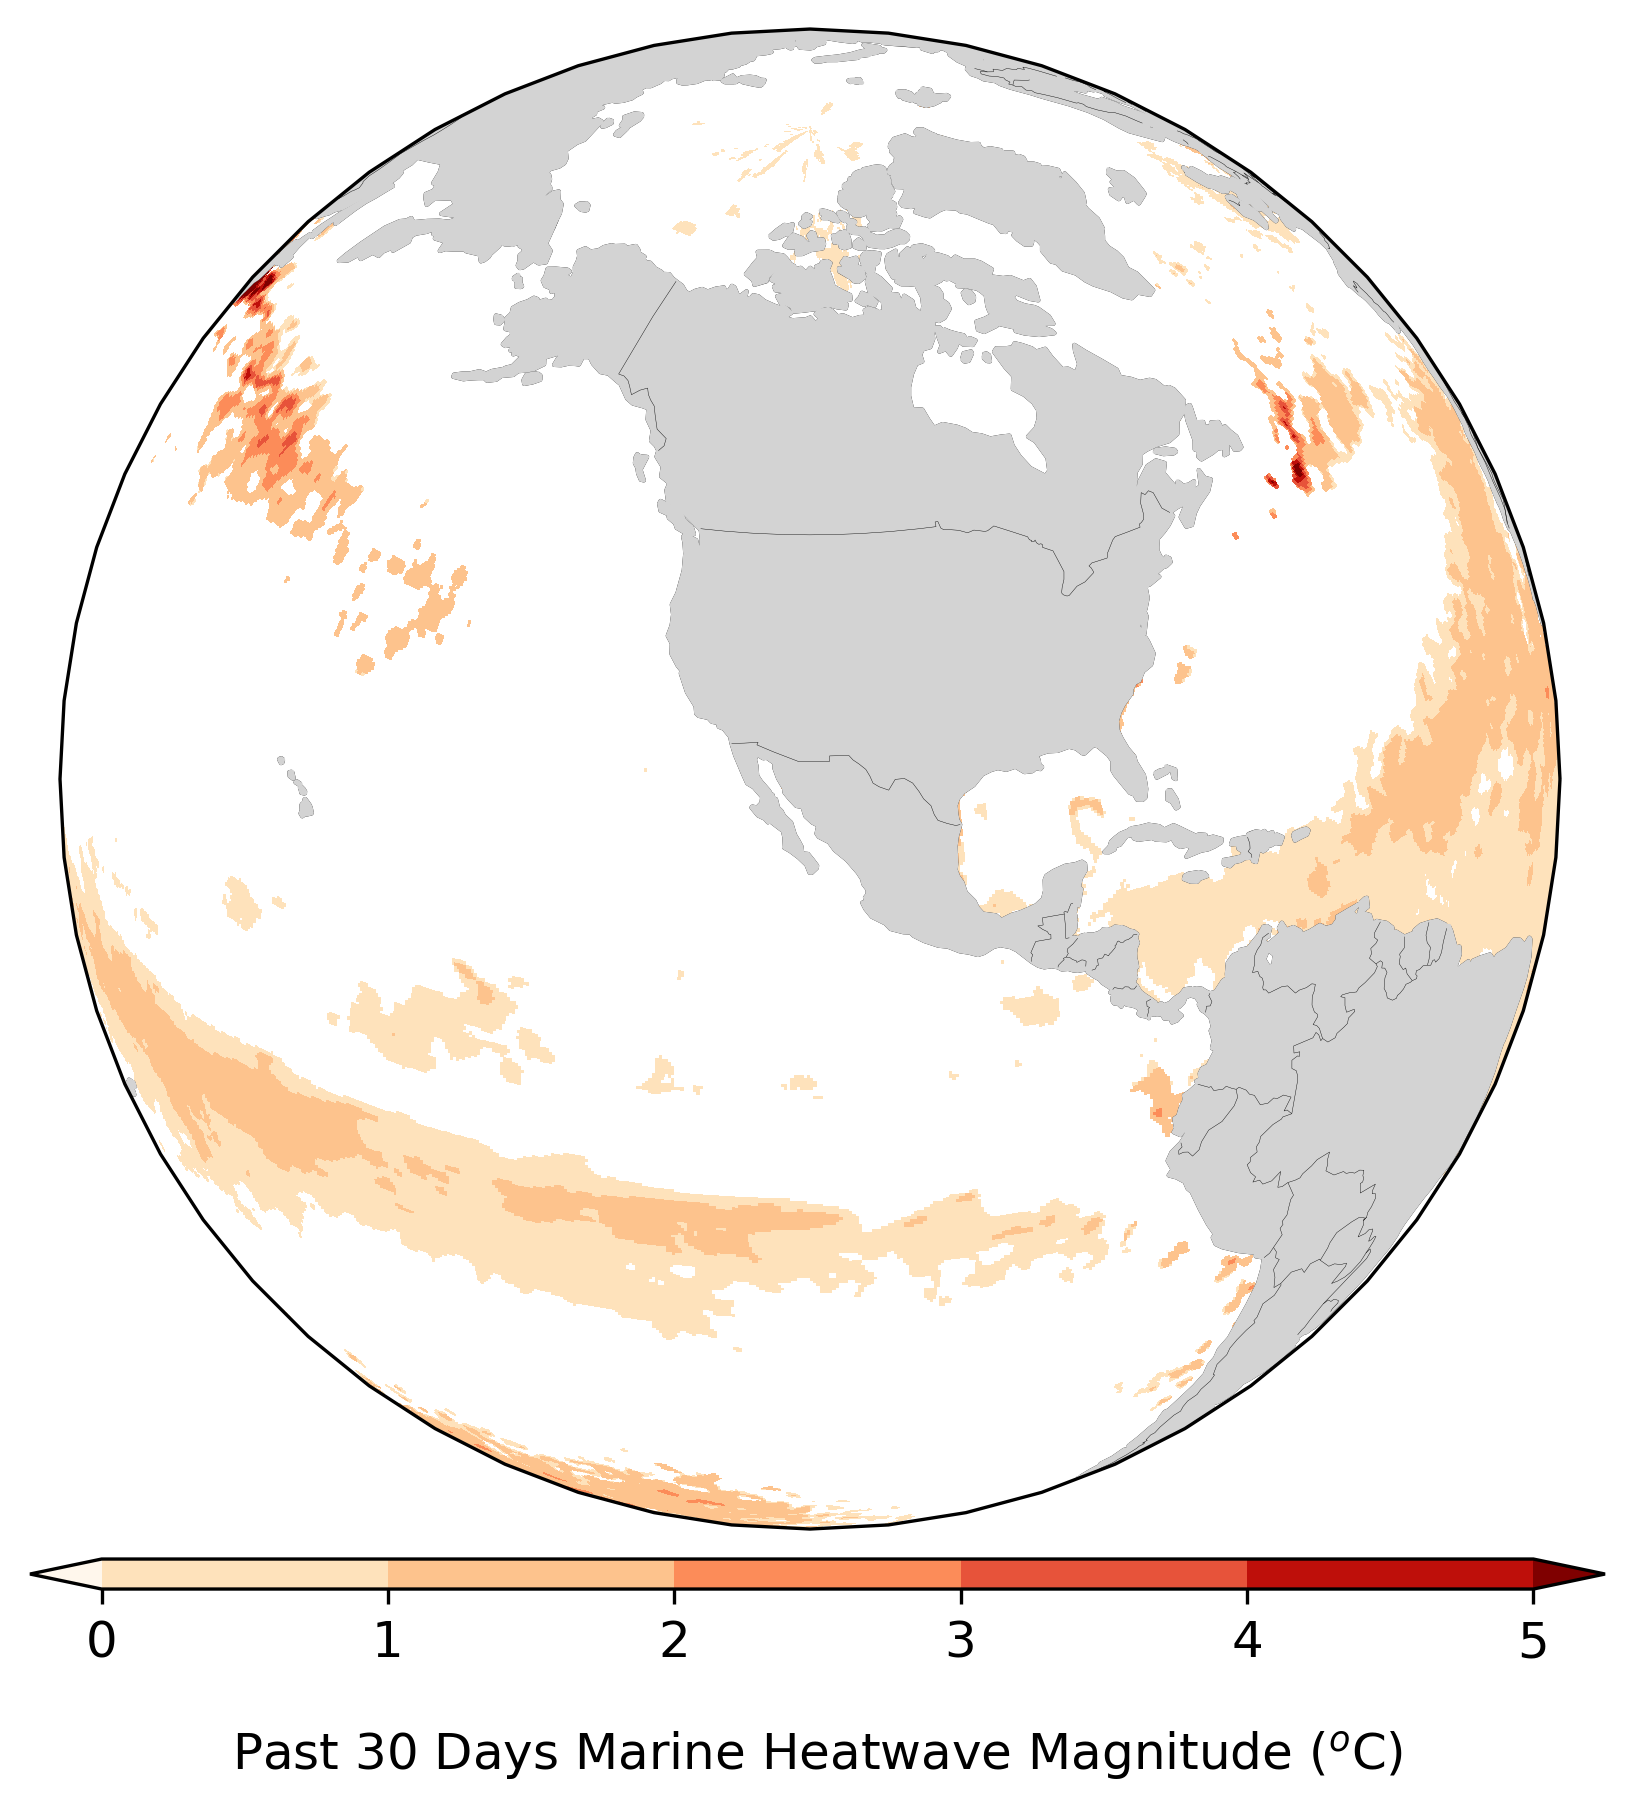
Marine Heat Waves (PSL's Marine Heatwave Page)
Current Global Marine Heatwaves (detrended)
Current US Region Marine Heatwaves (detrended)
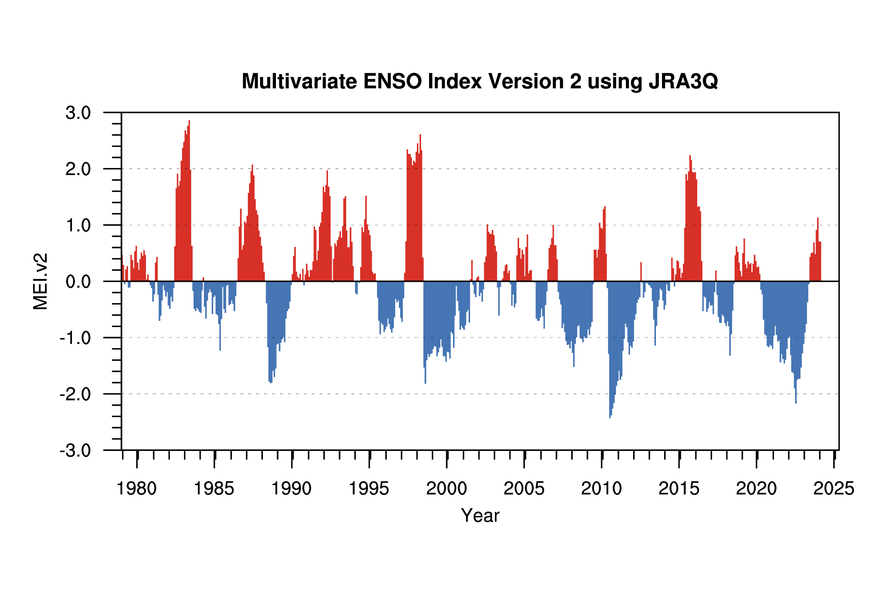
Multivariate ENSO Index (MEI)
An experimental ENSO monitoring tool showing departures from normal conditions in the tropical Pacific from 1950-present.
Forecasts
The ability to forecast El Niño and La Niña events is extremely important as these events tend to be associated with consistent climate variations in the tropics and can even influence the atmosphere around the world. There are two types of forecasts: those obtained from various ocean–atmosphere models and those obtained from statistical models. These models vary in their skill and sometimes can even do better during certain phases of ENSO than others. Forecasters try to take all this in account when making predictions.
Official NOAA ENSO Forecasts from the Climate Prediction Center
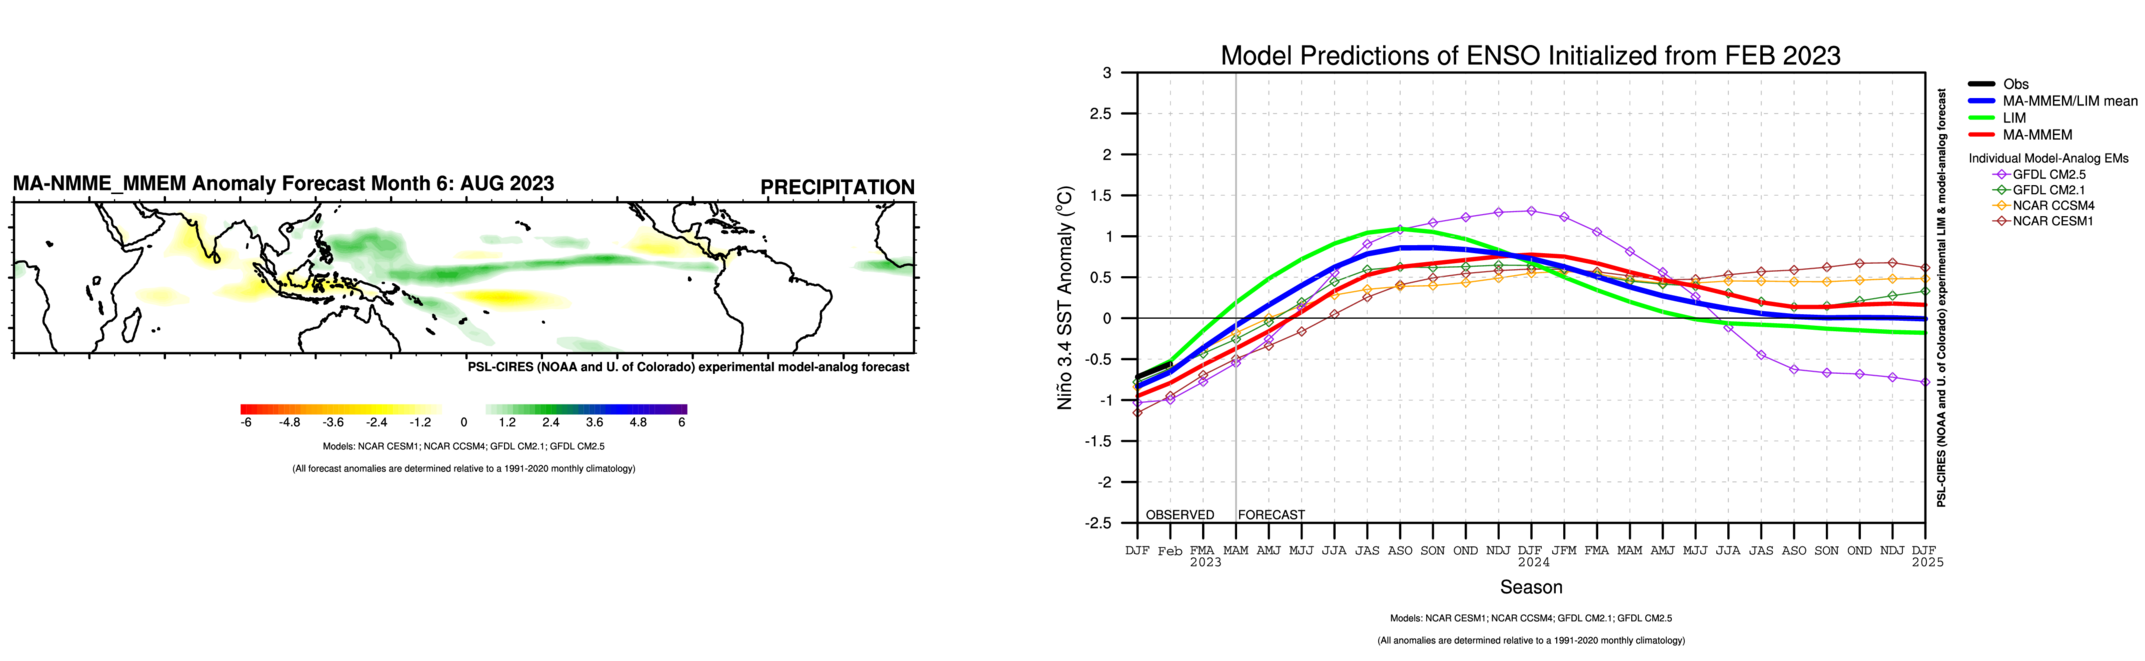
PSL Experimental ENSO Forecasts
Linear Inverse Modeling SST/ENSO Forecast
Experimental forecasts (sample images below) of numerous tropical fields, including precipitation, outgoing longwave radiation (OLR), sea surface temperature (SST), and sea surface height (SSH); other variables may become available at a later date.
More Information
- Collection of Other ENSO Forecasts (NOAA El Niño Theme Page)
Past Events
What years are ENSO years?
Because ENSO events differ in their strength, coverage, and seasonality, there isn't unanimous agreement on what constitutes and ENSO event. But, there are broad agreements and you can find some of the lists researchers have used along with how they chose those years. The list in the right column represents ENSO years based on PSL's Extended Multivariate ENSO Index (MEI.ext) and after that, the MEIV2.
You may also be interested in:
Animations of Selected Past Events
1982–1983 El Niño
2010–2011 La Niña
1991–1992 El Niño
1988–1989 La Niña
1997–1998 El Niño
1999–2000 La Niña
Past ENSO Years
El Niño
18971900
1903
1906
1915
1919
1926
1931
1941
1942
1958
1966
1973
1978
1980
1983
1987
1988
1992
1995
1998
2003
2007
2010
2016
Neutral
18961898-1899
1901-1902
1905
1907-1908
1912-1914
1916
1920-1924
1927-1930
1932-1933
1935-1938
1940
1944-1949
1952-1954
1957
1959-1961
1963-1965
1967-1970
1972
1975
1977
1979
1981-1982
1984-1986
1990-1991
1993-1994
1996-1997
2001-2002
2004-2006
2009
2013-2015
2017-2020
La Niña
19041909
1910
1911
1917
1918
1925
1934
1939
1943
1950
1951
1955
1956
1962
1971
1974
1976
1989
1999
2000
2008
2011
2012
2021
2022
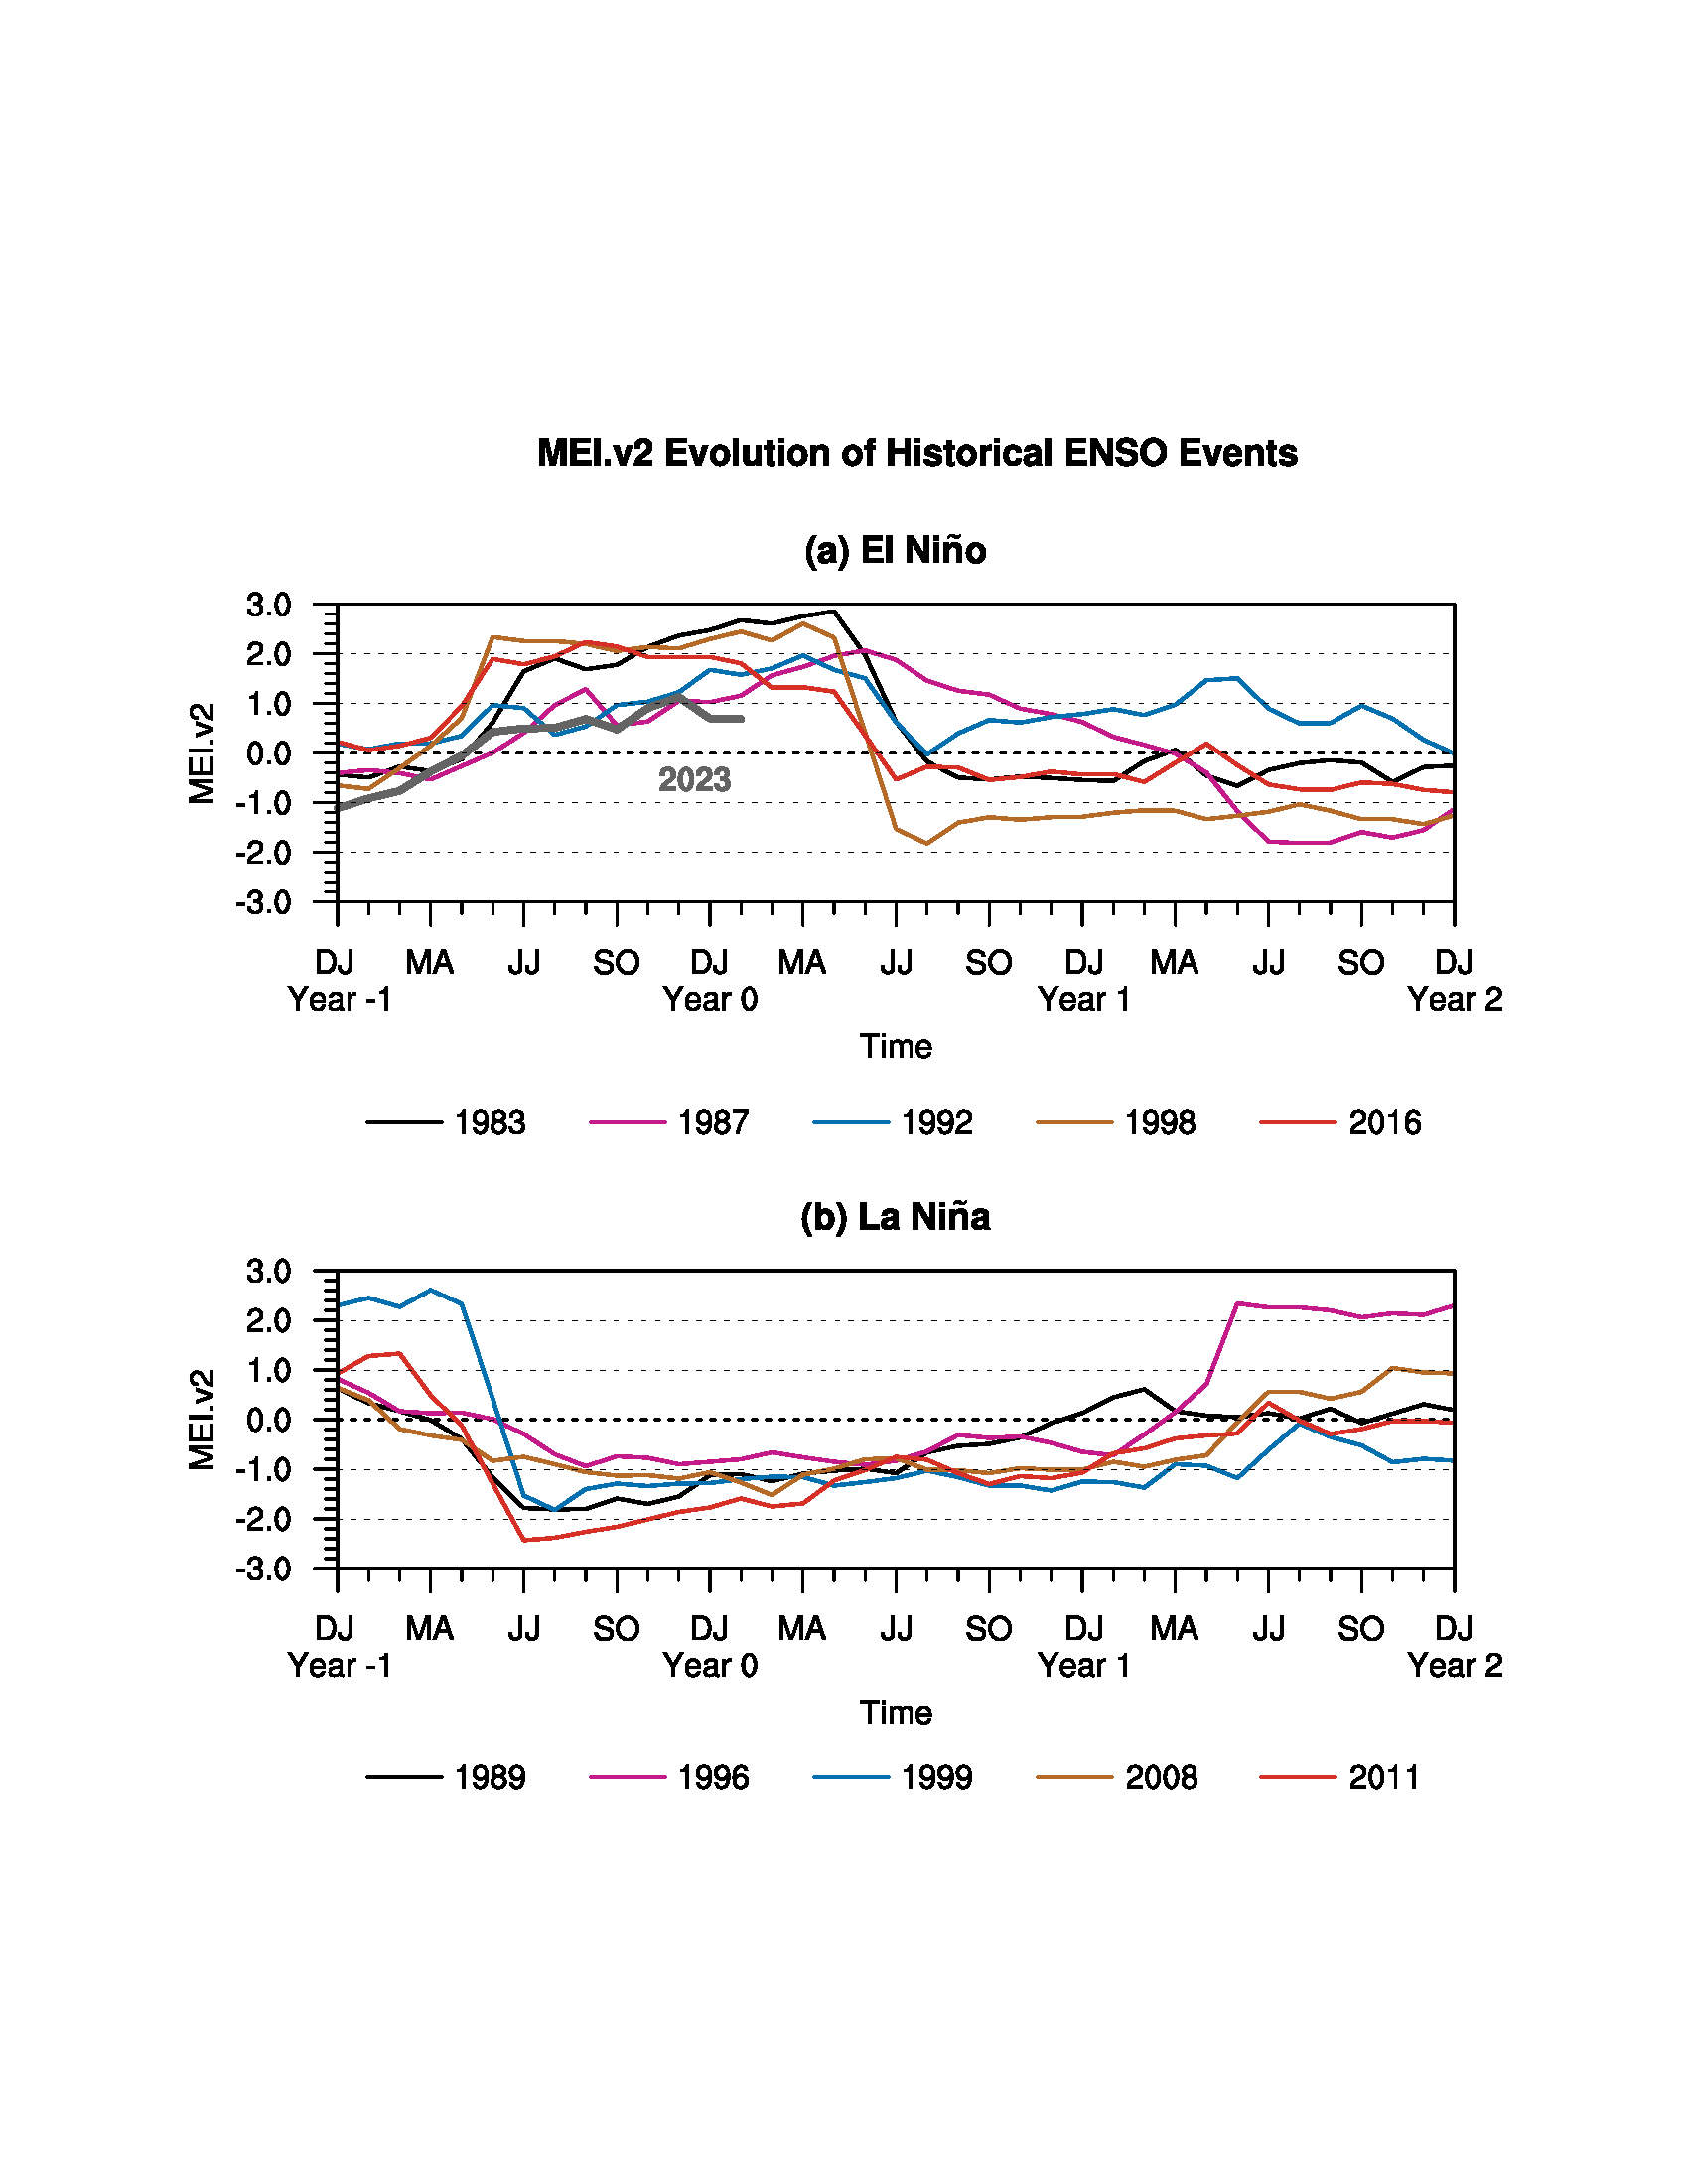
Comparison of Timeseries of Historic Events
Temporal evolution of El Niño and La Niña events indicated by the MEI.v2. Shown are the top 5 warm and cold non-overlapping events since 1979. Year 0 corresponds to the year of the event in the legends. Click on image to enlarge.
Explore Historic Climate Relationships
El Niño and La Niña can cause the "seasonal climate" – the cumulative effects of the weather over a season – to deviate from normal at many places around the globe. The following PSL pages can be used to analyze what happened during past El Niños and La Niñas and provide a guide to what may happen in the future.
Average ENSO Climate Relationships
A number of ENSO events are averaged together over differeing time periods in order to reduce interannual "noise".Updated! Global/US Seasonal ENSO Related Variables
This tool allows single or comparison plots of seasonal averaged variables in relation to El Niño and La Niña over the US and the globe.
New! FEWS NET: Historic ENSO-Related Climate Impacts
Historical temperature/precipitation ENSO probabilities are available for countries associated with the FEWS NET program.
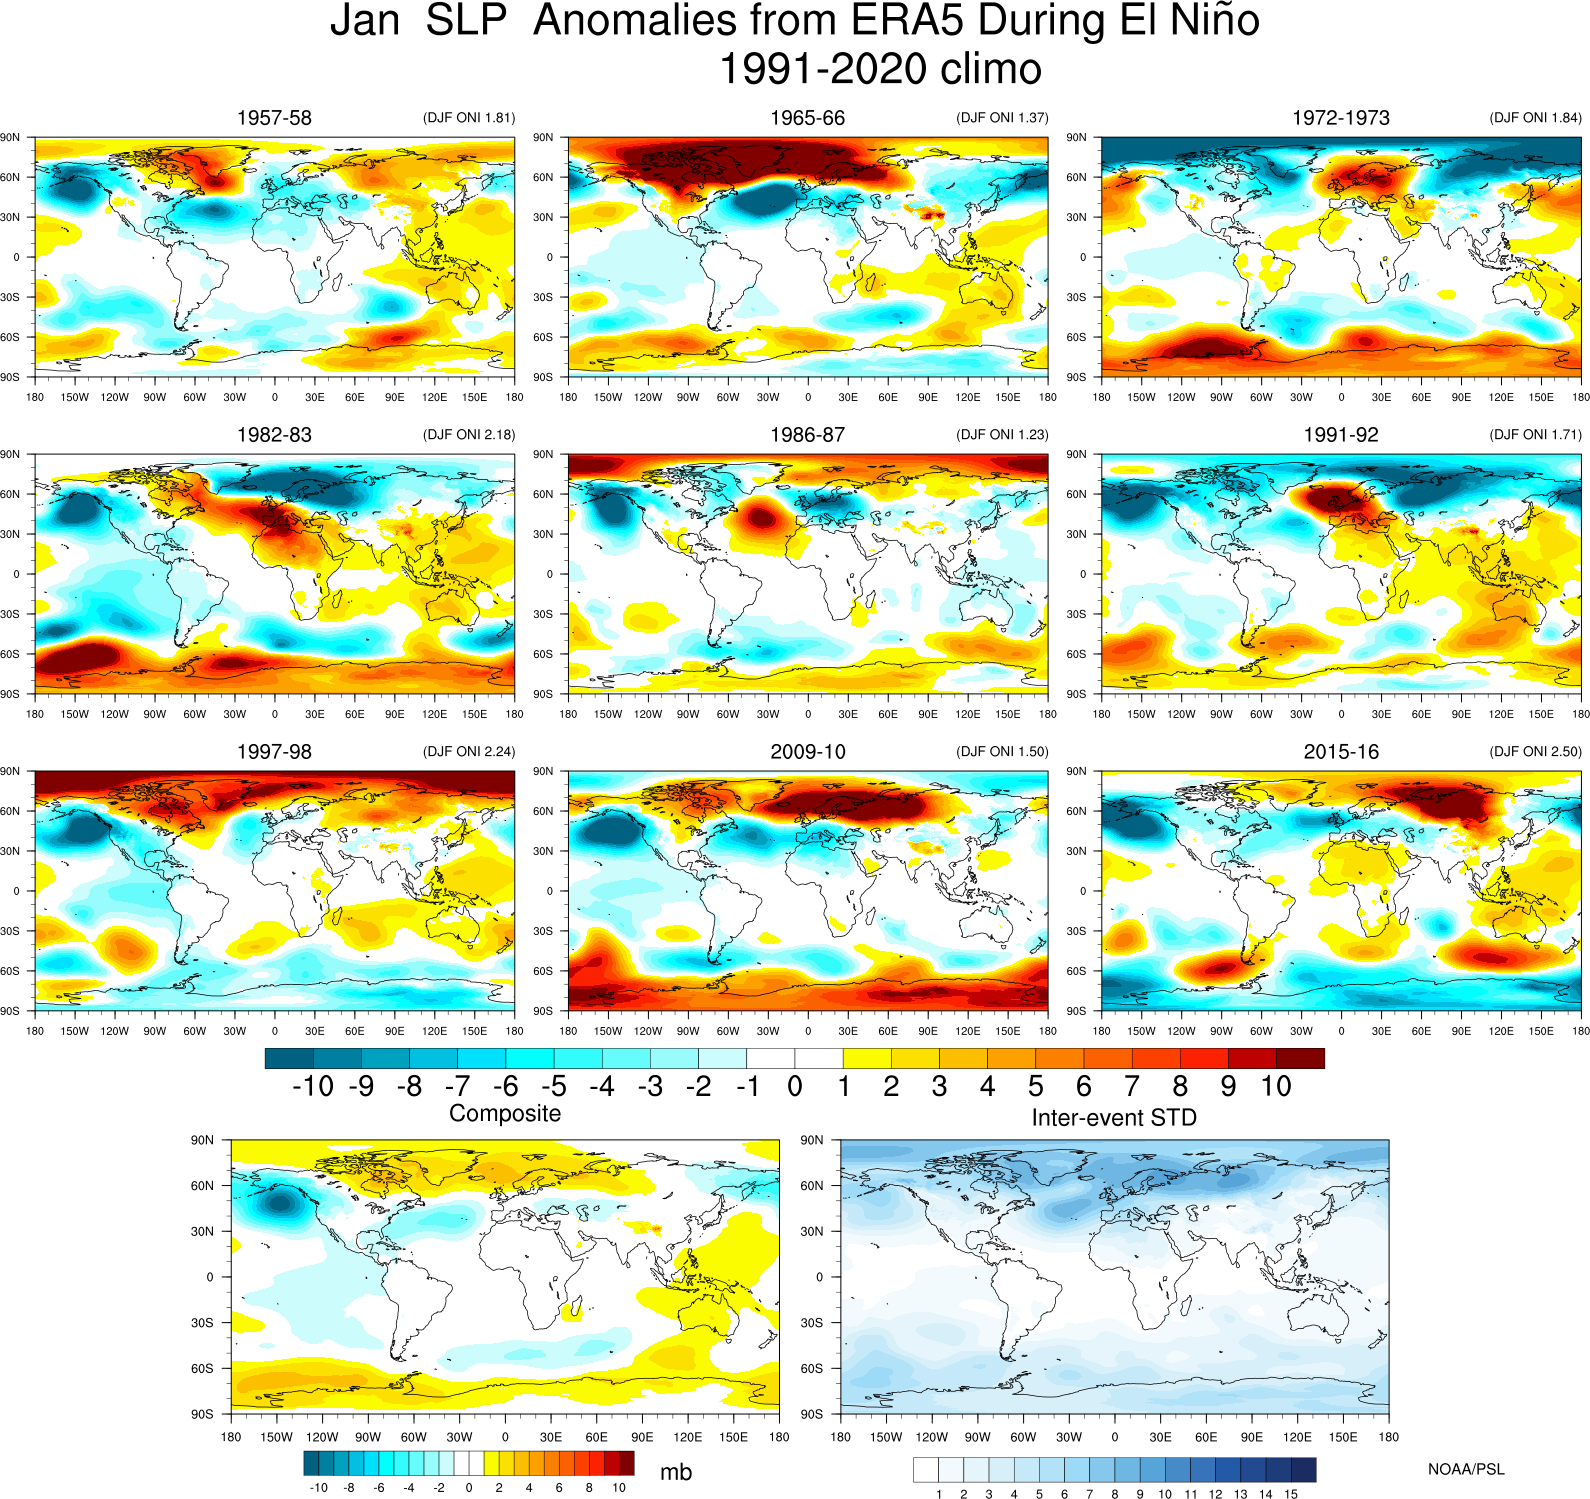
How ENSO Events Differ
Not all El Nino and La Nina events are the same and there are other differences in the base state between events. For example, there is a strong trend in surface air temperature and the number and timing of MJO events can vary.Updated!Selected Variables by month for El Niño/La Niña including composite mean and inter-event standard deviation with many different types of variables.
Comparisons of Different El Niño and La Niña Events
Animations, plots, and more: These links give an indication of how similar and how different the atmosphere/ocean can be during events.

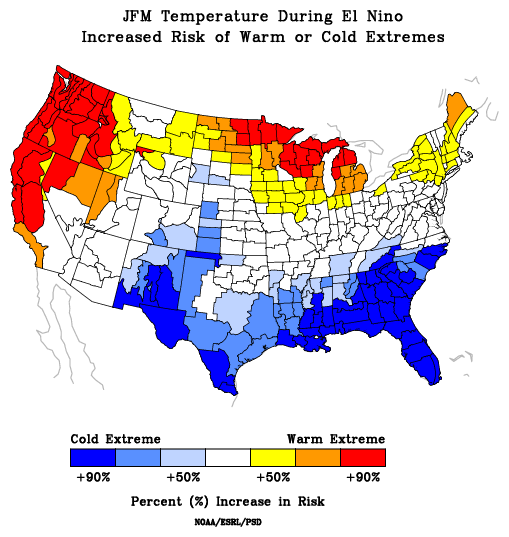
Seasonal Extremes
ENSO can have impacts not just on average climate biut also on the extremes of seasonal values.Effects on Seasonal Climate Extremes of Temperature and Precipitation Over the US
("Risk Plots")
Given an El Niño or La Niña condition, what are the odds of getting a warm versus a cold season? A wet versus a dry season?
Datasets Useful for ENSO Research
Sea Surface Temperature (SST)
Gridded SST datasets are available for monthly means and for daily. Values can be mean or anomalies. Gaps usually exist in SST dataets both in space and time. Different datasets use different models to fill in gaps.
| Datasets | Areal Coverage | Grid Size | Time Step | Time Coverage | Levels |
|---|---|---|---|---|---|
| [an error occurred while processing this directive] | Global | 5.0°x5.0° | Monthly | 1850-2013 | None |
| ICOADS | Global | 2.0°x2.0°,1.0°x1.0° | Monthly | 1800-present | None |
| Kaplan SST | Global | 5.0°x5.0° | Monthly | 1856-present | None |
| NCEP GODAS ocean analysis | Global | .3°x.3° | Monthly | 1980-present | 40 |
| NCEP/NCAR Reanalysis | Global | 2.5°x2.5°, T42 Gaussian, T62 spectral | 4X Daily, Daily, Monthly | 1948-present | 17 pressure levels, 28 spectral |
| NOAA Extended Reconstructed SST V5 | Global | 1.0°x1.0° | Monthly | 1854-present | None |
| NOAA High-resolution Blended Analysis of Daily SST and Ice. | Global | .25°x.25° | Daily | 1981-present | None |
| NOAA Global Surface Temperature (NOAAGlobalTemp) | Global | 5.0°x5.0° | Daily | 1880-present | None |
| NOAA Optimum Interpolation (OI) SST V2 | Global | 1.0°x1.0° | Monthly,Weekly | 1981-present | None |
| COBE-SST | Global | 1.0°x1.0° | Monthly | 1891-present | None |
| COBE-SST2 Sea Surface Temperature | Global | 1.0°x1.0° | Monthly | 1850-2012 | None |
| NODC (Levitus) World Ocean Atlas 1998 | Global | 1.0°x1.0° | Monthly,Annual | Climo | None |
Outgoing Long Wave Radiation (OLR)
OLR is a measure of tropical convection and has been available via satellite observations since the early 1970's. We make available gridded interpolated values as well as the provided directly from NCEP (which are more recent).
| Datasets | Areal Coverage | Grid Size | Time Step | Time Coverage | Levels |
|---|---|---|---|---|---|
| Interpolated OLR | Global | 2.5°x2.5° | Daily,Monthly | 1979-near present | None |
| Uninterpolated OLR | Global | 2.5°x2.5° | Daily | 1991-present | None |
Precipitation
For ENSO, precipitation is both associated with changed forcing in the tropics and also is a response to changed flow over the globe.
| Datasets | Areal Coverage | Grid Size | Time Step | Time Coverage | Levels |
|---|---|---|---|---|---|
| GPCP V2.3 Precipitation | Global | 2.5°x2.5° | Daily,Monthly | 1979-near present | None |
| Global Precipitation Climatology Centre (GPCC) | Global | 2.5°x2.5° | Daily | 1991-present | None |
| NOAA's Precipitation Reconstruction (PREC) | Global | 2.5°x2.5° | Monthly | 1979-present | None |
Climate Indices relating to ENSO
While ENSO is a process that varies both in space and time, it can be convenient to use single time series to represent in monitoring and analysis. Some of these time series are SST averages in a specific region of the tropical Pacific while others use more than 1 variable to attempt to capture more of the dynamical processes that occur in ENSO. Some indices measure the diffrences between events.
| Name | Region | Date Range |
|---|---|---|
| Oceanic Niño Index (ONI) | SST 5N-5S, 170W-120W | 1950-present |
| Niño 1.2 | SST 0-10S, 90W-80W | 1870-present |
| Niño 3 | SST 5N-5S, 150W-90W | 1870-present |
| Niño 3.4 | SST 5N-5S, 170W-120W | 1870-present |
| Niño 4 | SST 5N-5S, 160E-150W | 1870-present |
| Multivariate ENSO index: MEI V2 | Tropical Pacific | 1979-present |
| Extended Multivariate ENSO index: MEI.ext | Tropical Pacific | 1871-2005 |
| Trans-Niño Index (TNI) | Difference Niño 1.2 and Niña 4 | 1870-present |
| Southern Oscillation Index (SOI) | Difference of Surface Pressure of Tahiti and Darwin | 1870-present |
Other Datasets
As ENSO impacts weather and climate in general, researchers need to potentially look at all atmospheric and ocean variables. PSL maintains an extensive collection of gridded datasets including our NOAA-CIRES-DOE Twenthieth Century Reanalysis V3. Other dataset can be found from links on PSL's data information webpage. Some other NOAA sites also link to ENSO related datasets: for example, NOAA/CPC has an ENSO data/info list.
Resources and Additional Information
Related Websites
- NOAA Climate.gov ENSO Page
- NOAA Climate Prediction Center El Niño Page
- NOAA Pacific Marine Environmental Laboratory El Niño Theme Page
- Western Regional Climate Center ENSO Page
Definitions
Videos
- Understanding El Niño (NOAA climate.gov)
- Understanding La Niña (NOAA climate.gov)
- Observing El Niño (NOAA 'Ocean Today')
- Potential Impacts of El Niño in Colorado (by NOAA/PSL and CIRES)
Media Contact
-
NOAA Boulder Public Affairs Officer:
Theo.Stein@noaa.gov, (303) 497-6288