PSL generates experimental forecasts on time-scales of weeks to seasons as part of its research mission.
The forecasts and associated information such as verifications are available on the following webpages. It
is planned that these forecasts will eventually be transitioned to operational mode.
Experimental forecasts of numerous tropical fields, including precipitation, outgoing longwave radiation (OLR), sea surface temperature (SST), and sea surface height (SSH).
Current Month 6 MA precipitation forecast and Niño3.4 Months 1-24 forecast from all models.
Experimental, sea ice forecasts produced from a fully coupled ~9km ice(CICE5)-ocean(POP2)-land(CLM4.5)-atmosphere(WRF3.5) model called RASM-ESRL. The model is initialized with the NOAA Global Forecast System (GFS) analyses, CRYOSAT2 sea ice thickness, and Advanced Microwave Scanning Radiometer 2 (AMSR2) sea ice concentrations. The model is forced at the lateral boundaries by 3-hourly GFS forecasts of winds, temperature, and water vapor.
The Famine Early Warning Systems Network, FEWS NET, provides objective, evidence-based analyses to help government decision-makers and relief agencies plan for and respond to humanitarian crises as a result of acute food insecurity. NOAA environmental monitoring and forecasting tools are being used to communicate likely weather and climate conditions to shape FEWS NET food security outlooks.
Experimental subseasonal outlooks (week 1, week 2, and combined weeks 3-4) are provided to demonstrate near real-time performance of conventional and deep-learning-based methods to calibrate raw precipitation accumulation forecasts from NOAA’s Global Ensemble Forecast System version 12. Forecasts are presented as probabilities. Three methods are shown: raw GEFS output, CSGD post-processed guidance, and "RUFCO" neural-network post-processed guidance. Also included are hindcast skill scores and near real-time verification metrics.
An experimental probalistic forecast model tool is provided to improve agroclimatic forecasts for FEWS NET. It uses a multi-model ensemble using a hybrid system based on Dynamical models and Machine learning for Global and 12 regions. The hindcast period is uses 1993-2016 CHIRPS precipitation and CSM forecast model data. Plotted are various statistics for the seasonal and monthly precipitation forecasts.
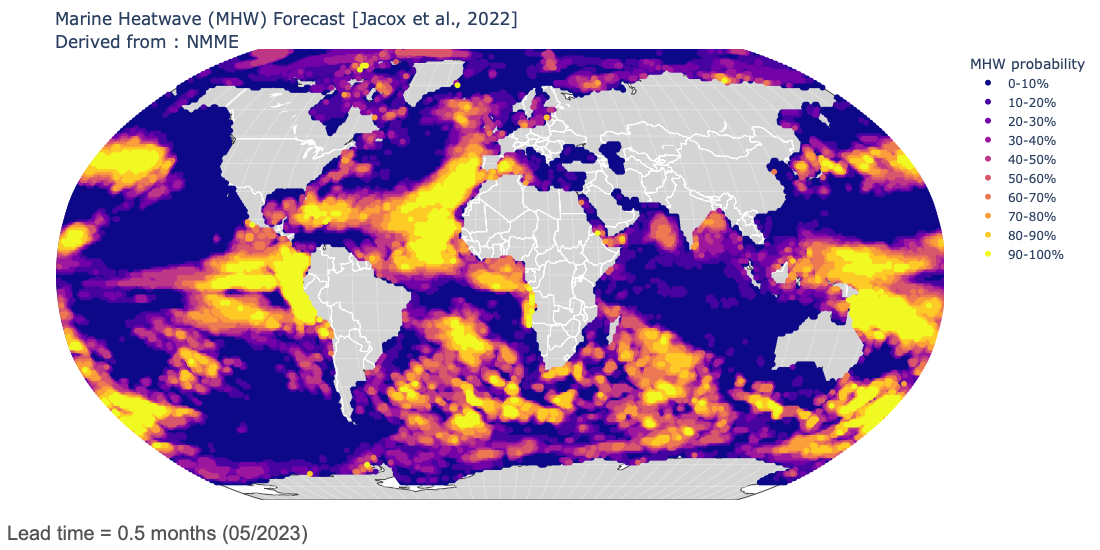
Experimental marine heatwave forecasts produced using sea surface temperature output from six global climate forecast systems contributing to the North American Multi-Model Ensemble (NMME). Forecasts provide global outlooks of marine heatwave probability for the next 12 months. Forecasts are updated monthly, and historical forecasts are available starting in 1991.